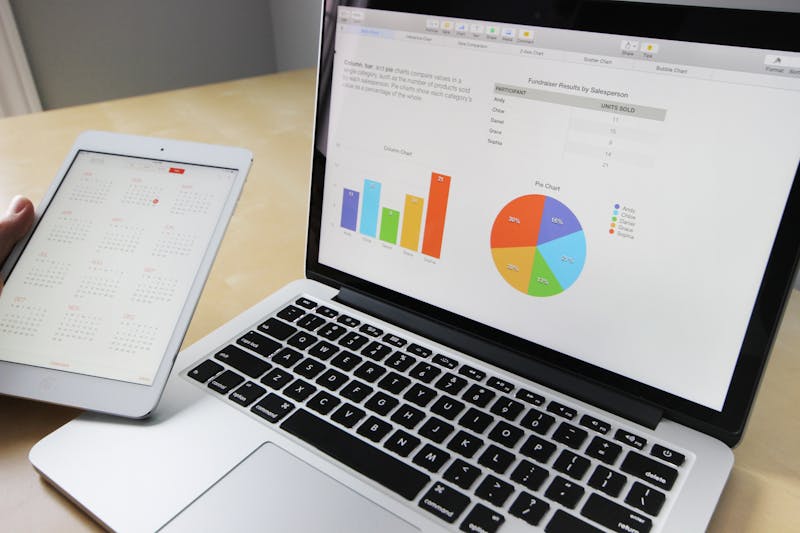
The Power of Real-Time Financial Dashboards
Most owners see November results in mid-December. Power BI connects to QuickBooks or Zoho Books and refreshes daily. Six dashboards worth building.

The Power of Real-Time Financial Dashboards
If your management accounts arrive on the fifteenth, you are running the business on six-week-old information. A problem that started in early November surfaces in mid-December, by which time you have spent a month responding to it without knowing it existed.
Power BI connects directly to QuickBooks Online and Zoho Books and refreshes on a schedule you set. This article covers six dashboards, how to connect them, and which KPIs belong on the front screen.
Why Traditional Financial Reporting Falls Short
The Monthly Reporting Problem
Most businesses receive financial statements monthly, often weeks after month-end:
Day 1-5: Bookkeeper closes books
Day 6-10: Accountant reviews and finalizes
Day 11-15: Financial statements delivered
Day 16+: Management finally sees results
By the time you see November results, it's mid-December. Problems that emerged in early November aren't detected for 6 weeks.
What You Miss Without Real-Time Dashboards
Cash flow issues develop silently until they become crises
Customer payment trends go unnoticed until DSO balloons
Margin erosion happens gradually across product lines
Expense overruns accumulate before budget reviews catch them
Sales trends shift before you can respond
A daily-refreshed dashboard closes each of those gaps.
What Makes Power BI Ideal for Financial Reporting
Power BI Advantages
Direct data source connection
Interactive exploration
Historical comparison
Accessible anywhere
Professional visualization
Power BI vs. Static Reports
| Feature | Static Reports | Power BI Dashboards |
|---|---|---|
| Data freshness | Weeks old | Real-time / daily |
| Interactivity | None | Full drill-down |
| Historical analysis | Manual comparison | Automatic trends |
| Access | Email PDF | Cloud access anytime |
| Customization | Request from accountant | Self-service exploration |
| Mobile access | Poor PDF viewing | Native mobile apps |
Essential Financial Dashboards for UAE Businesses
Dashboard 1: Executive Summary
Your at-a-glance business health dashboard:
Key metrics displayed:
Refresh frequency: Daily
Best for: Business owners, CEOs, board members
Dashboard 2: Cash Flow Monitor
Track your most critical metric—cash:
Visuals included:
Refresh frequency: Daily
Best for: Business owners, CFOs, finance managers
Dashboard 3: Revenue Analysis
Understand what drives your top line:
Analysis views:
Refresh frequency: Daily
Best for: Sales leaders, business owners, finance teams
Dashboard 4: Profitability Dashboard
Monitor margins and bottom-line performance:
Metrics tracked:
Refresh frequency: Weekly or monthly
Best for: Business owners, CFOs, operations managers
Dashboard 5: Accounts Receivable
Manage customer payments proactively:
Key insights:
Refresh frequency: Daily
Best for: Finance teams, credit managers, operations
Dashboard 6: Expense Control
Keep spending aligned with budget:
Tracking elements:
Refresh frequency: Weekly
Best for: Finance managers, department heads, business owners
Building Effective Financial Dashboards
Design Principles
1. Start with key questions
A dashboard exists to answer a question someone actually asks. Write the questions down first:
Build visuals that answer these questions directly.
2. Follow the 5-second rule
Users should grasp the key message within 5 seconds:
3. Enable drill-down exploration
Summary metrics at top, detail below:
Users explore based on their questions.
4. Show trends alongside the snapshot
Include time-series views:
Context matters as much as current numbers.
5. Make it actionable
Highlight what requires action:
A dashboard nobody acts on is a screensaver.
Connecting Power BI to Your Accounting System
QuickBooks Online Integration
Power BI connects to QuickBooks Online via:
Option 1: Direct connector
Option 2: API-based extraction
Data available:
Zoho Books Integration
Connect Power BI to Zoho Books through:
Option 1: Zoho Analytics
Option 2: Direct API
Excel-Based Approach
For businesses not ready for direct integration:
Process:
1. Export data from accounting system monthly
2. Save to OneDrive or SharePoint
3. Connect Power BI to Excel files
4. Refresh dashboards
Limitations: Not real-time, requires manual exports
Key Performance Indicators to Track
Liquidity KPIs
Current ratio = Current Assets ÷ Current Liabilities
Quick ratio = (Current Assets - Inventory) ÷ Current Liabilities
Cash runway = Cash Balance ÷ Average Monthly Burn
Profitability KPIs
Gross profit margin % = (Revenue - COGS) ÷ Revenue
Operating margin % = Operating Income ÷ Revenue
Net profit margin % = Net Income ÷ Revenue
Efficiency KPIs
Days sales outstanding (DSO) = (Accounts Receivable ÷ Revenue) × 365
Accounts payable days = (Accounts Payable ÷ COGS) × 365
Inventory turnover = COGS ÷ Average Inventory
Growth KPIs
Revenue growth rate % = ((Current Period - Prior Period) ÷ Prior Period) × 100
Customer acquisition cost (CAC) = Marketing & Sales Costs ÷ New Customers
Customer lifetime value (LTV) = Average Revenue per Customer × Average Lifetime
Real-World Dashboard Examples
Case Study: Retail Business Dashboard
Challenge: Multi-location retailer needed visibility into per-store performance
Solution: Power BI dashboard with:
Result: Identified underperforming locations, optimized inventory allocation, reduced labor costs by 12%
Case Study: Professional Services Dashboard
Challenge: Consulting firm struggled to track project profitability
Solution: Power BI dashboard featuring:
Result: Improved project margins by 8%, identified highest-value clients, optimized resource allocation
Case Study: Trading Company Dashboard
Challenge: Import/export business needed better cash flow visibility
Solution: Power BI dashboard displaying:
Result: Reduced DSO by 15 days, avoided cash shortfalls, optimized currency hedging
Implementing Dashboards Successfully
Step 1: Define Requirements
Identify stakeholders:
Prioritize metrics:
Set refresh requirements:
Step 2: Prepare Data
Clean accounting data:
Establish data governance:
Set up connections:
Step 3: Build Dashboards
Start simple:
Follow best practices:
Document everything:
Step 4: Train and Deploy
Train users:
Establish processes:
Step 5: Maintain and Evolve
Monitor usage:
Continuous improvement:
Common Dashboard Pitfalls
Pitfall 1: Too Much Information
Dashboards with 50+ metrics overwhelm users. Focus on the vital few.
Pitfall 2: Poor Data Quality
Dashboards only work with clean, accurate data. Fix accounting data first.
Pitfall 3: No Defined Purpose
Building dashboards without clear questions to answer creates expensive decorations.
Pitfall 4: Lack of Training
Users won't adopt dashboards they don't understand. Invest in training.
Pitfall 5: Set-and-Forget Approach
Dashboards require maintenance as business needs evolve.
Getting Expert Support
Building financial dashboards draws on:
Ratio provides Power BI dashboard services for UAE businesses:
Dashboard design and development - Financial dashboards built around your chart of accounts
Accounting system integration - Connect QuickBooks, Zoho Books, or other systems
Data quality assurance - Clean, accurate accounting data for reliable dashboards
KPI consulting - Identify the right metrics for your industry and growth stage
Training and support - So the dashboard gets used after week two
Ongoing maintenance - Updates as the business changes shape
Conclusion
The gap between a problem starting and you seeing it is the number that matters. Monthly reporting makes that gap six weeks. A daily-refreshed dashboard makes it one day.
Three of the case studies above moved a real number: 12% off labour cost, 8% onto project margin, 15 days off DSO. None of that came from the software. It came from someone finally seeing the figure while there was still time to act on it.
Set up properly, you can:
Ready to implement real-time financial dashboards? Ratio designs and builds Power BI dashboards for UAE businesses. Contact us.
Frequently asked questions
- Can Power BI connect to QuickBooks Online or Zoho Books?
- Yes. Power BI can connect to QuickBooks Online and Zoho Books and refresh financial data on a schedule, typically daily. That replaces month-old static reports with dashboards that show current cash, revenue, receivables and expenses. Where a direct connection is not practical, an Excel export can serve as an interim data source.
- Which financial dashboards should a small business start with?
- Most small businesses should start with an executive summary, a cash flow monitor and an accounts receivable dashboard. Those three answer the questions owners ask most often: how the business is performing, how much cash is available, and who owes money. Revenue, profitability and expense dashboards can follow once the basics are trusted.
- What KPIs should a financial dashboard track?
- A financial dashboard should track a small set of KPIs across liquidity, profitability, efficiency and growth. Typical examples are cash position, gross and net margin, debtor days and revenue growth against the prior period. Each KPI should have an owner and a target, otherwise the dashboard becomes decoration rather than a decision tool.
- Why do financial dashboards fail?
- Financial dashboards usually fail because of poor data quality, too much information, no defined purpose or no training for the people meant to use them. A dashboard is only as reliable as the books underneath it, so clean, reconciled monthly accounts come first. Dashboards also need regular review as the business and its questions change.